
When we’re evaluating a SaaS business at Terem, one of the first things we ask for is a cohesive view of customer metrics over time. You’d be surprised how often this request is met with a static revenue figure, a headcount of customers, and not much else.
That’s not a red flag about the business. It’s usually just a gap in how founders have been taught to tell their story. So we wrote this post to explain exactly what we’re looking for, why each number matters, and how to put it all together in a way that gives us (and any serious acquirer) real confidence in your business.
The Two Lenses: Revenue and Logos
We look at SaaS customer metrics through two parallel lenses: Revenue (specifically recurring revenue, expressed as MRR or ARR) and Logos (the number of customers). Both tell a story. Revenue tells you the financial health. Logos tell you the operational reality underneath it. A business can show growing MRR while quietly losing customers, and vice versa. You need both to see the full picture.
The MRR Bridge
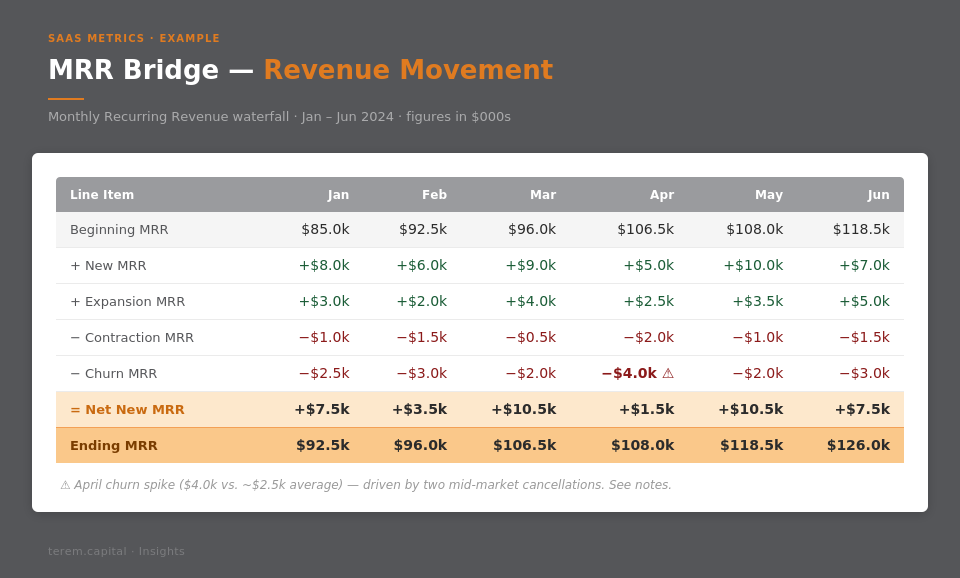
The most useful format for showing revenue movement is what’s commonly called an MRR Bridge: a month-by-month waterfall that explains exactly where your revenue came from and where it went. Here’s how it’s structured:
| Line Item | What It Means |
|---|---|
| Beginning MRR | Ending MRR from the prior month |
| New MRR | Revenue from customers who signed up this month for the first time |
| Expansion MRR | Additional revenue from existing customers: upgrades, add-ons, seat growth |
| Contraction MRR | Revenue lost from existing customers who downgraded or reduced usage |
| Churn MRR | Revenue lost from customers who cancelled entirely |
| Net New MRR | (New + Expansion) − (Contraction + Churn) |
| Ending MRR | Beginning MRR + Net New MRR |
The bridge should be a rolling table, ideally 24–36 months of history. What we’re looking for isn’t perfection in every line item; it’s predictability and explainability. If Churn MRR spikes in a particular month, we want to be able to see it, ask about it, and understand whether it was a one-off or a pattern.
MRR vs ARR: Which One to Use
The bridge above is expressed in MRR. But many B2B SaaS businesses bill annually, and some founders will naturally think and report in ARR (Annual Recurring Revenue). Both are fine; the mechanics are identical, it’s just a question of which unit you’re working in.
If you bill monthly, use MRR. The bridge works naturally: every month is a clean snapshot of what came in, what expanded, what churned.
If you bill annually, you can either divide all contract values by 12 and present in MRR terms, or present in ARR with an annual bridge. We have no strong preference, but consistency matters. Don’t mix the two.
The more important issue with annual billing is timing. In a monthly-billed business, churn is visible immediately. In an annually-billed business, a customer can effectively be “churned in spirit” (disengaged, evaluating alternatives, not going to renew) but their revenue won’t appear as Churn MRR until the renewal date arrives. This means the bridge for an annual-billing business can look deceptively smooth right up until renewal season hits.
To account for this, we’ll ask you to share your renewal schedule alongside the bridge: which contracts are coming up for renewal in the next 12 months, their ARR value, and your current read on renewal probability. For annual-billing businesses, this forward-looking view is as important to us as the historical bridge.
Long-Term Contracts
Some B2B SaaS businesses (particularly those selling into enterprise or government) operate on multi-year contracts of three years or longer. This changes the shape of the metrics in a few important ways.
Logo churn becomes a lagging indicator. A customer locked into a 3-year contract technically cannot churn until renewal, so your Gross Logo Churn Rate might look excellent not because retention is strong, but because customers simply have no exit ramp yet. We’ll look carefully at what’s contractually locked versus what’s coming up for renewal in the next 12–18 months and weight our view of retention risk accordingly.
Expansion and contraction timing shifts. In shorter-contract businesses, customers can upgrade or downgrade relatively fluidly. In long-term contract businesses, expansion often happens through mid-contract amendments or add-on orders rather than at renewal. Make sure your bridge captures these movements. They’re real economic events and we want to see them regardless of when the contract formally renews.
Contracted ARR vs. At-Risk ARR. For businesses with a mix of contract lengths, it helps to present a simple split: how much of your ARR is locked into contracts with more than 12 months remaining, versus how much is coming up for renewal within the year. This tells us a lot about the near-term revenue risk profile and helps us avoid over- or under-weighting the historical churn numbers.
Weighted Average Contract Length (WACL). If you have meaningful variation in contract terms across your customer base, knowing your WACL is useful context. A business with a WACL of 30 months is a very different risk profile to one averaging 12 months, even if the headline retention rates look the same.
The Logo Bridge
We want the same bridging structure applied to customer count. Every movement in MRR should have a corresponding movement in logo numbers:
| Line Item | What It Means |
|---|---|
| Beginning Logos | Customer count at the start of the month |
| New Logos | New customers acquired this month |
| Churned Logos | Customers who cancelled entirely |
| Net Logos Added | New Logos − Churned Logos |
| Ending Logos | Beginning Logos + Net Logos Added |
Note: Unlike the MRR bridge, logos don’t have an expansion or contraction equivalent. A customer either exists or they don’t. Upsells show up in MRR, not in logo count.
The reason we want this alongside the revenue bridge is that blended averages can be deceiving. A business with 50 customers averaging $2,000 MRR each looks identical in revenue to one with 100 customers averaging $1,000, but they’re very different businesses in terms of concentration risk, sales motion, and churn dynamics.
![]()
The Rollup Metrics
Once we have the bridges, we use them to calculate a standard set of SaaS health metrics. These are the numbers we’ll reference throughout diligence and use to benchmark your business against comparable acquisitions.
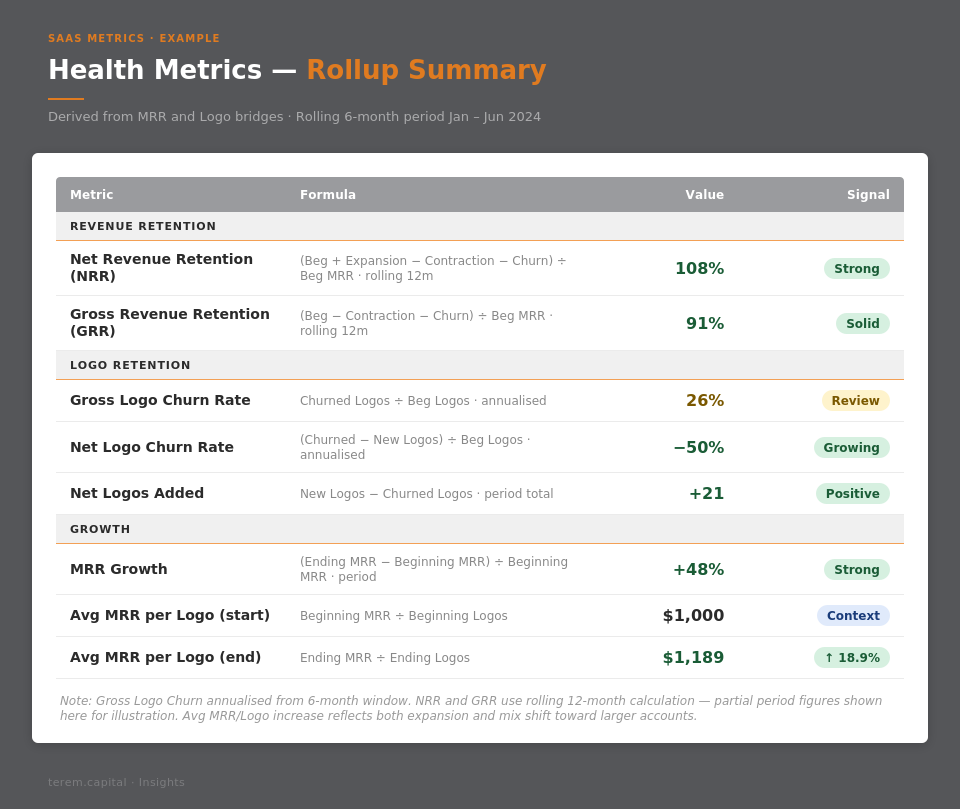
Net Revenue Retention (NRR)
Also called Net Dollar Retention (NDR)
NRR measures how much revenue you retain and grow from your existing customer base over a period, without counting new logo revenue.
Formula: (Beginning MRR + Expansion MRR − Contraction MRR − Churn MRR) ÷ Beginning MRR
We calculate this on a rolling 12-month basis to smooth out seasonal noise. An NRR above 100% means your existing customers are worth more over time than when they signed up: expansion is outpacing churn. This is one of the most powerful indicators of product-market fit and long-term business health we look at.
Gross Revenue Retention (GRR)
GRR is NRR with expansion stripped out. It measures your ability to simply hold onto the revenue you already have.
Formula: (Beginning MRR − Contraction MRR − Churn MRR) ÷ Beginning MRR
GRR can never exceed 100%. It tells us your revenue floor: if you stopped acquiring new logos and stopped expanding existing accounts today, how much of your current revenue would still be there in 12 months?
Gross Logo Churn Rate
Formula: Churned Logos ÷ Beginning Logos (rolling 12 months)
This tells us the raw rate at which you’re losing customers, regardless of their size. High logo churn in the SMB segment can be structural and manageable; high logo churn in the enterprise segment is a serious problem. Context matters here, which is why we also want to understand your customer segmentation alongside this number.
Net Logo Churn Rate
Formula: (Churned Logos − New Logos) ÷ Beginning Logos
If this number is negative, you’re growing your customer base. If it’s positive, you’re shrinking. Simple, but often clarifying.
Net Logos Added
The absolute number of logos added in a period (New − Churned). We track this alongside the rate to understand the raw growth trajectory of the customer base.
Services Revenue: Where It Fits (and Where It Doesn’t)
Many B2B SaaS businesses (particularly those selling into mid-market or enterprise) carry some form of services revenue alongside their software subscription. This typically comes in two forms:
One-time services: implementation, onboarding, configuration, or custom development billed at the start of a customer relationship.
Ongoing services: managed services, dedicated support tiers, or professional services retainers that recur but sit outside the core software subscription.
Neither of these belongs inside your MRR bridge. Mixing services revenue into your SaaS metrics distorts the picture in ways that become apparent during diligence and cause friction. Here’s how we think about each:
One-time implementation fees should be reported separately and clearly. We understand they exist (in many B2B SaaS businesses they’re a necessary part of onboarding complex customers), but they’re non-recurring by nature. Including them in MRR artificially inflates New MRR and makes cohort economics look better than they are. Show them as a separate line and be prepared to discuss whether they’re margin-positive or effectively a cost of sale you’re subsidising.
Ongoing managed services or support retainers are more nuanced. If a customer pays $3,000/month for software and $2,000/month for a managed service wrapper, you have $5,000 in recurring revenue, but only $3,000 of it is the kind of scalable, high-margin SaaS revenue that drives software-style valuation multiples. We’ll always want to see these split. The managed services component is genuinely valuable. It often creates deep switching costs and strong retention, but it’s valued differently and we need to understand the margin profile of each independently.
As a general rule: keep your SaaS metrics clean. Show services revenue alongside them, clearly labelled, and we’ll form a view of the blended business. Founders who proactively separate these and can speak to the margin profile of each come across as more sophisticated, not less. It signals you understand how acquirers think about your business.
Why We Ask for All of This
The goal isn’t to drown you in a spreadsheet exercise. It’s to give us (and you) a shared, honest language for what’s actually happening in the business.
Founders who can produce this data quickly and cleanly almost always have a stronger grasp of their unit economics, and that confidence is contagious in a diligence process. It dramatically shortens the time between LOI and close, and gives us a much stronger basis for pricing the business fairly, which means less negotiation friction on both sides.
If you’re preparing to bring a SaaS business to market and you don’t yet have this data structured this way, we’re happy to help you think through it. Reach out to us directly, or take a look at our other resources on preparing for an M&A process.